Simplifying and Visualising Sustainability Data

Accelerate your data extractions with the Pelt8 API.

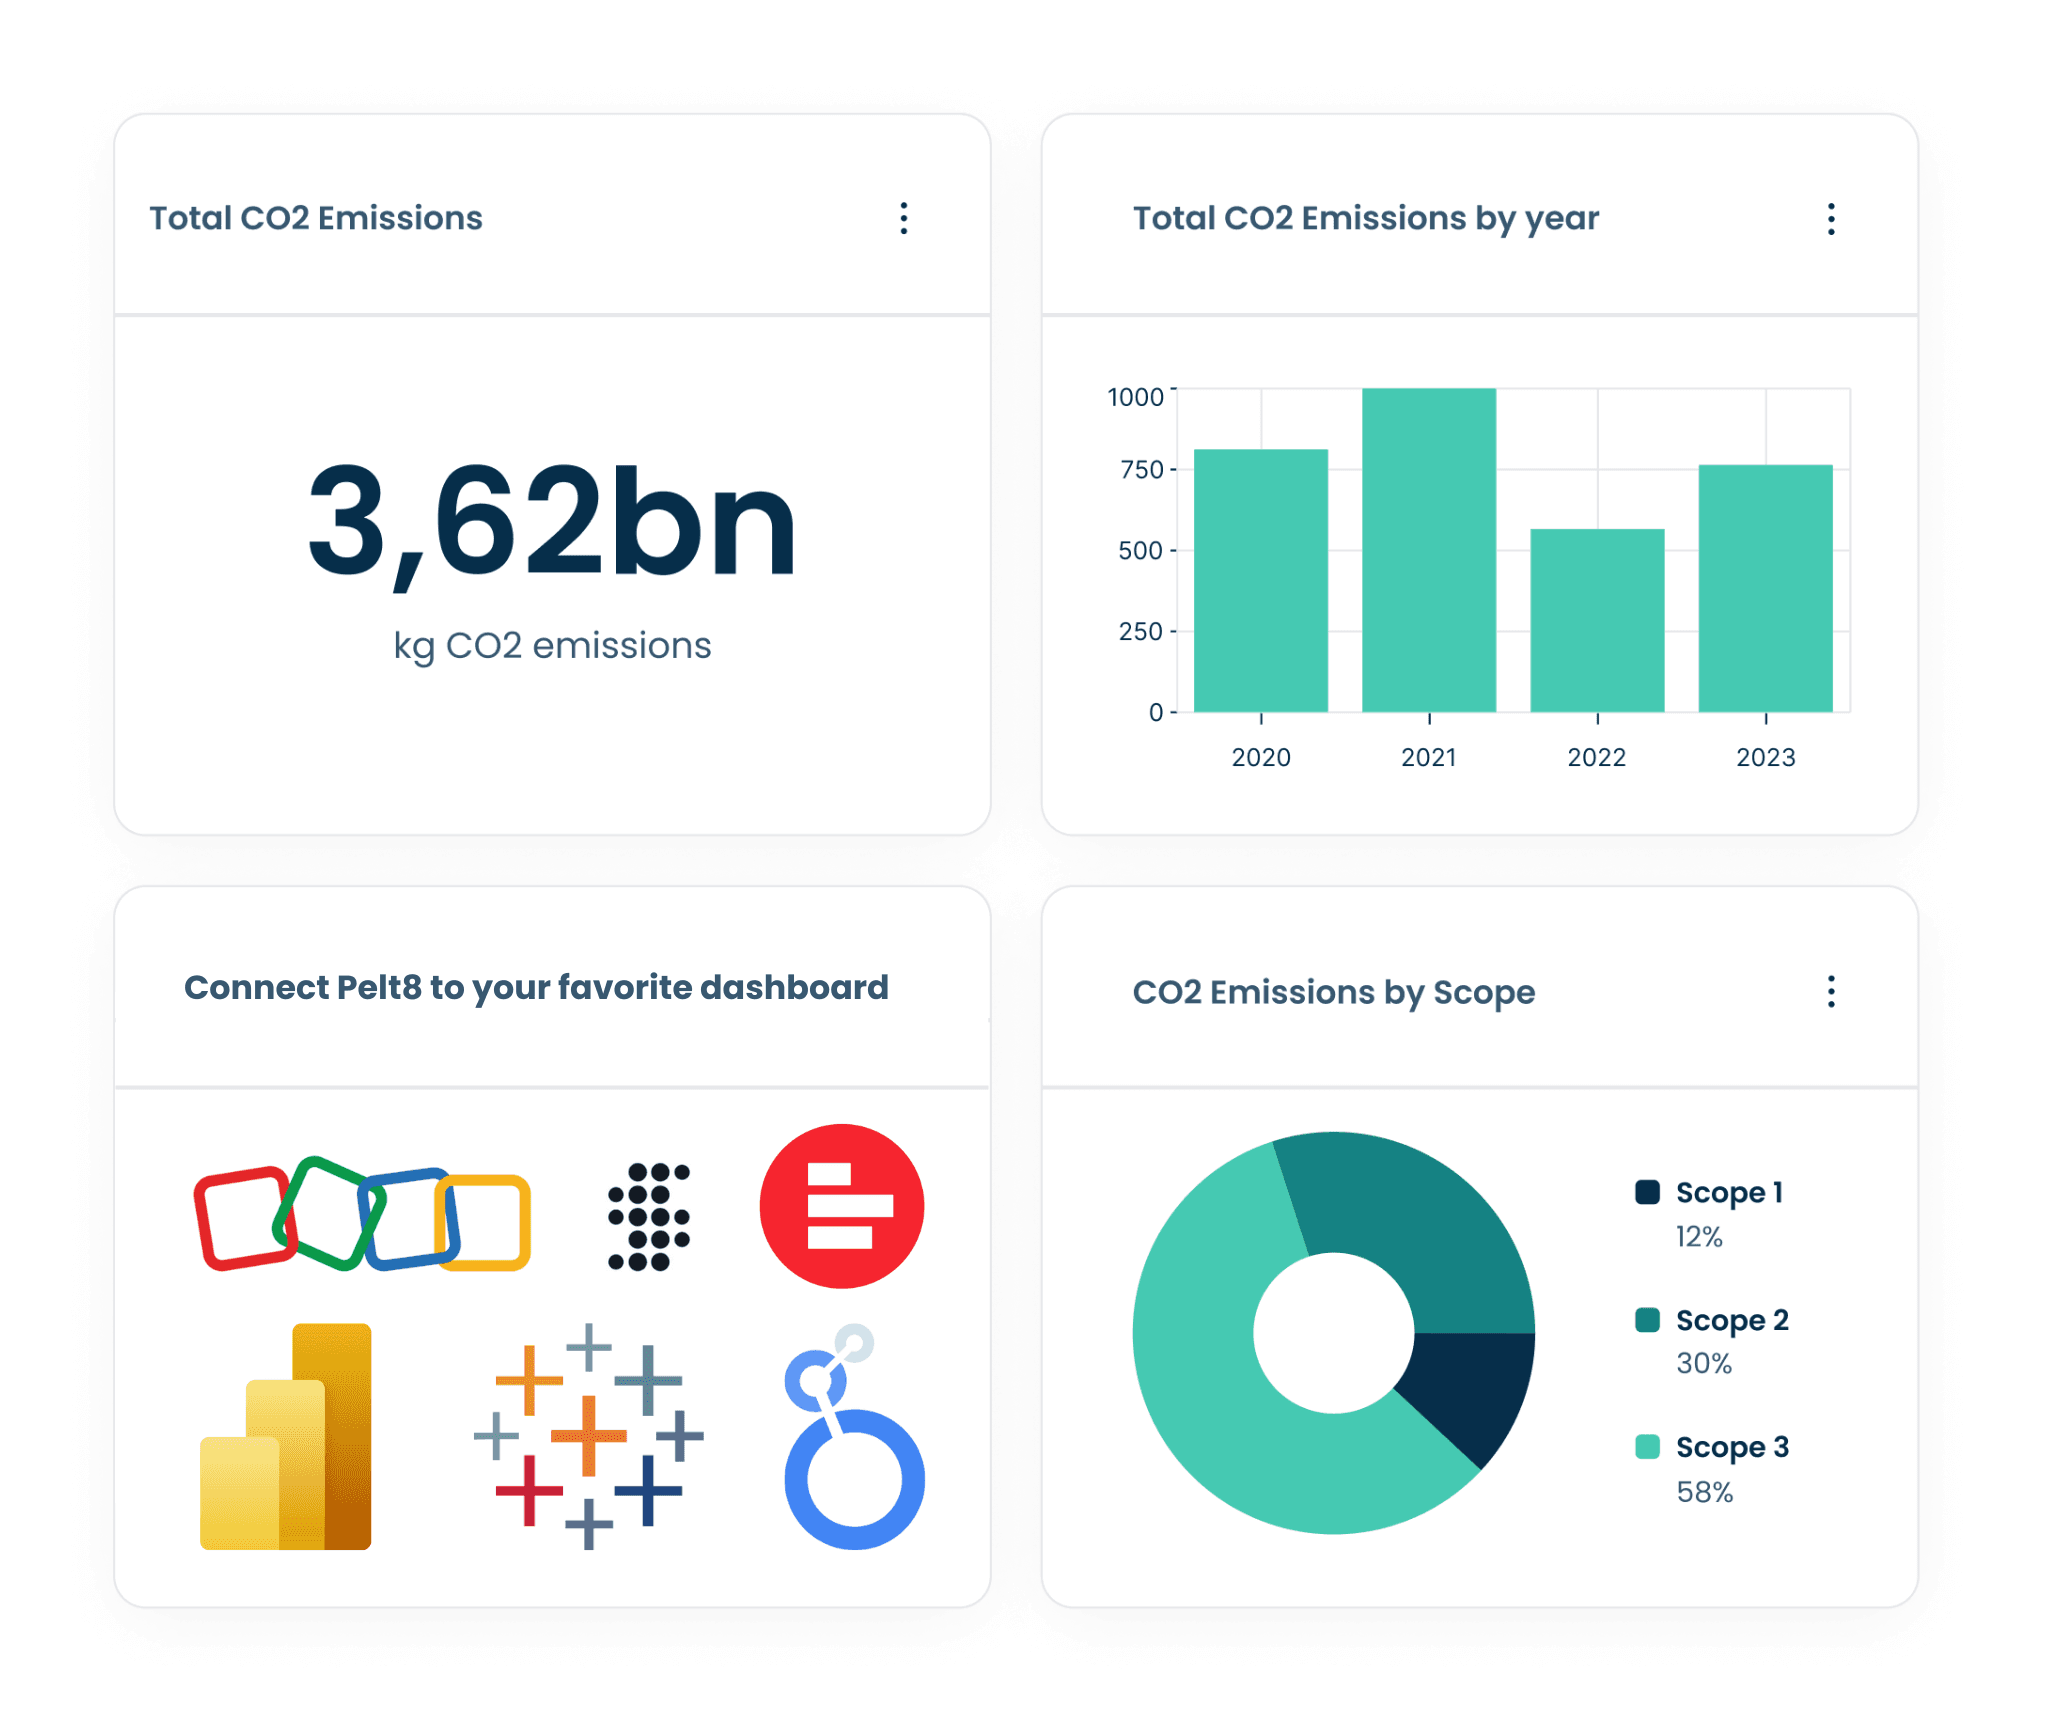
Bring your data to where it’s most useful to you.

Full access.

No credit card required.

No strings attached.

Sustainability reporting software

Trusted by industry leaders

Struggling to gain useful insights from your sustainability data?

Scattered data across multiple systems.

Time-consuming manual processes for compiling reports.

Difficulty in integrating sustainability data into business intelligence tools.

Lack of flexibility in how reports are generated and shared.

Pelt8 integrates your data seamlessly into your existing tools

How Pelt8 Helps

With Pelt8, you can generate and share sustainability insights in three ways:

Static Reports (For Traditional Reporting)

Export structured reports in Excel, PowerPoint, or PDF. Publish reports on your website for stakeholders. Example: An Excel table or a PowerPoint summary based on sustainability data.

Static Reports (For Traditional Reporting)

Export structured reports in Excel, PowerPoint, or PDF. Publish reports on your website for stakeholders. Example: An Excel table or a PowerPoint summary based on sustainability data.

Static Reports (For Traditional Reporting)

Export structured reports in Excel, PowerPoint, or PDF. Publish reports on your website for stakeholders. Example: An Excel table or a PowerPoint summary based on sustainability data.

Dynamic Reports (For Live Dashboards)

Generate interactive dashboards in Power BI (more tools to come). Access data via a secure URL with an access code, allowing embedding into tools like Power BI, Tableau, Supermetrics, Looker Studio, ZOHO, SiSense, and others.

Dynamic Reports (For Live Dashboards)

Generate interactive dashboards in Power BI (more tools to come). Access data via a secure URL with an access code, allowing embedding into tools like Power BI, Tableau, Supermetrics, Looker Studio, ZOHO, SiSense, and others.

Dynamic Reports (For Live Dashboards)

Generate interactive dashboards in Power BI (more tools to come). Access data via a secure URL with an access code, allowing embedding into tools like Power BI, Tableau, Supermetrics, Looker Studio, ZOHO, SiSense, and others.

API Integrations (For Custom Use Cases)

Plug Pelt8 data into any business system (ERP's, CRM's etc.), including SAP, Oracle, Salesforce and Hubspot, or other analytics tools. Use our API to automate workflows and connect data effortlessly.

API Integrations (For Custom Use Cases)

Plug Pelt8 data into any business system (ERP's, CRM's etc.), including SAP, Oracle, Salesforce and Hubspot, or other analytics tools. Use our API to automate workflows and connect data effortlessly.

API Integrations (For Custom Use Cases)

Plug Pelt8 data into any business system (ERP's, CRM's etc.), including SAP, Oracle, Salesforce and Hubspot, or other analytics tools. Use our API to automate workflows and connect data effortlessly.

Inboud API (Coming soon)

Future update: Inbound API integration to import sustainability data from other tools into Pelt8.

Inboud API (Coming soon)

Future update: Inbound API integration to import sustainability data from other tools into Pelt8.

Inboud API (Coming soon)

Future update: Inbound API integration to import sustainability data from other tools into Pelt8.

Why Pelt8 for your sustainability data

1. Authenticate

Authenticate 70+ supported data sources with one click. and some blablaba and so on, maybe a bit more even.

2. Choose format

Choose the output format (JSON, CSV, or custom format for Power BI & Tableau). Build the queries for extraction from each data source.

3. Upload into your BI tool

Your sustainability data is ready to be loaded into your BI tool or your custom application.

How the API integration works:

Retrieve Data Points:

The endpoint pulls a list of sustainability-related data points for your organization. Each data point corresponds to a specific measure or metric tracked across your organizational units.

The endpoint pulls a list of sustainability-related data points for your organization. Each data point corresponds to a specific measure or metric tracked across your organizational units.

Provide Detailed Context:

Each data point includes detailed information, such as the organizational unit, reporting values (e.g., CO2e, input units), data sources, explanations, and dates (e.g., reporting and submission dates). This ensures every metric is well-documented and traceable.

Each data point includes detailed information, such as the organizational unit, reporting values (e.g., CO2e, input units), data sources, explanations, and dates (e.g., reporting and submission dates). This ensures every metric is well-documented and traceable.

Display in a Global Table:

The data is organized into a comprehensive table, showing all metrics across your organization in one place for easy review, reporting, or integration with other tools.

The data is organized into a comprehensive table, showing all metrics across your organization in one place for easy review, reporting, or integration with other tools.

Happy Client Sustainability Reporting Software Tool Pelt8

Patrick Ickhead -

Sustainability Manager

"With Pelt8, we turned scattered sustainability data into actionable insights, saving time and making reporting effortless."

Happy Client Sustainability Reporting Software Tool Pelt8

Patrick Ickhead -

Sustainability Manager

"With Pelt8, we turned scattered sustainability data into actionable insights, saving time and making reporting effortless."

Happy Client Sustainability Reporting Software Tool Pelt8

Patrick Ickhead -

Sustainability Manager

"With Pelt8, we turned scattered sustainability data into actionable insights, saving time and making reporting effortless."

Happy Client Sustainability Reporting Software Tool Pelt8

Patrick Ickhead -

Sustainability Manager

"With Pelt8, we turned scattered sustainability data into actionable insights, saving time and making reporting effortless."

Sustainability reporting FAQs

Can Pelt8 handle both numeric and narrative data for sustainability reporting?

How does Pelt8 calculate emissions data, and can I customize the methodology?

What kind of data validation features does Pelt8 provide?

How does the API integration work for exporting sustainability data to our internal systems?

Learn how Pelt8 can integrate with your workflow.

Learn how Pelt8 can integrate with your workflow.

Learn how Pelt8 can integrate with your workflow.

Learn how Pelt8 can integrate with your workflow.